


Product: Life Cycle, Types, Levels, Product-market Fit, Margin, Development Steps, Positioning, Differentiation, Failure Rate, Mix

A product is any good, service, or idea that a business offers to satisfy a customer need or want. Key aspects include types, life cycle, product-market fit, levels, development steps, margin, differentiation, positioning, mix, and failure rate. In marketing, the product sits at the centre of the marketing mix, shaping how you approach price, promotion, and distribution. You can examine it through its levels, from the core benefit to the augmented features that surround it. Searching for an internet marketing company near me is a common way businesses look for outside help when promoting a product online, which shows how closely product decisions connect to channel choices. This article goes on to explain the main product types, the stages of the life cycle, the steps of product development, and the idea of product-market fit.
Key Takeaways
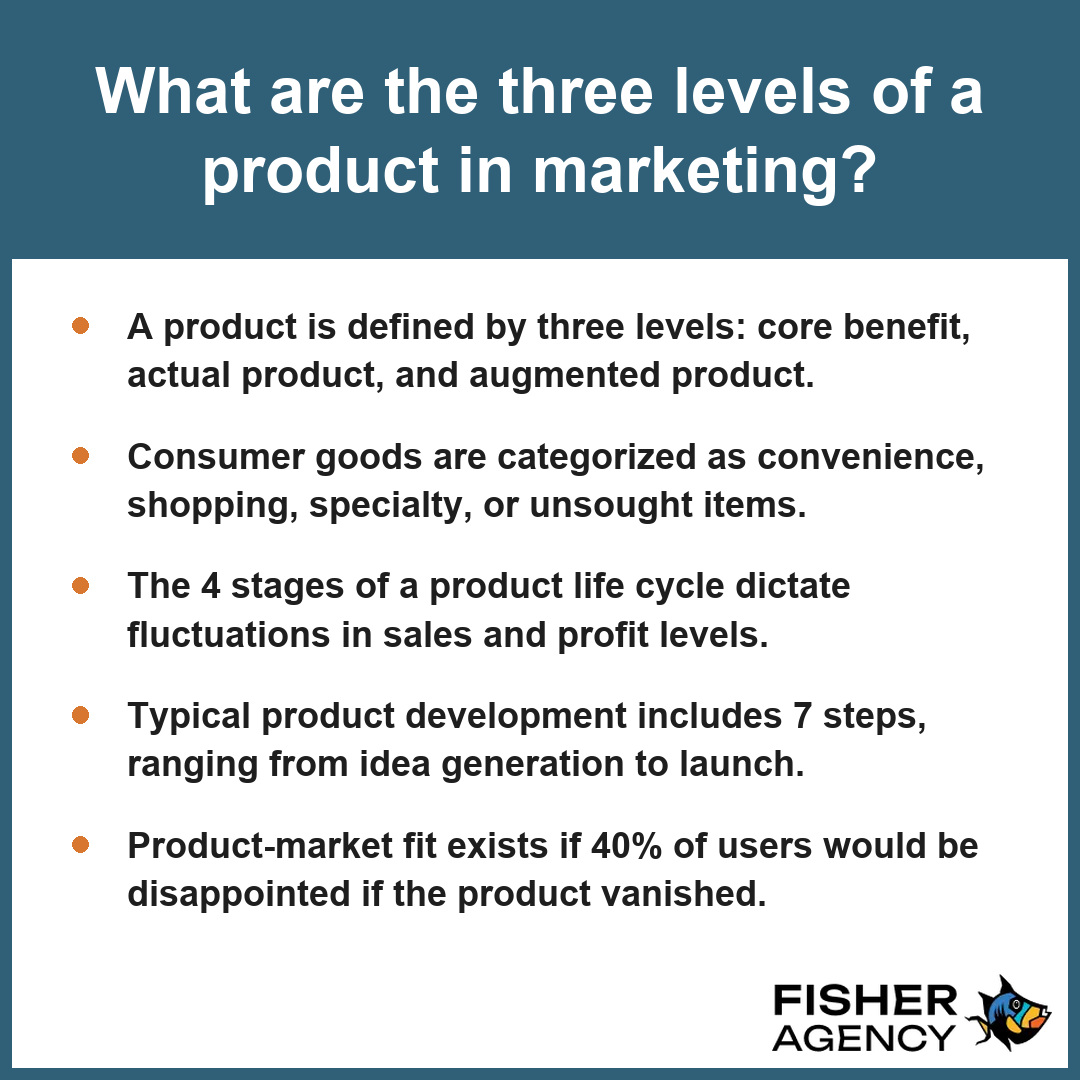
- A product is defined by three levels: core benefit, actual product, and augmented product.
- Consumer goods are categorized as convenience, shopping, specialty, or unsought items.
- The 4 stages of a product life cycle dictate fluctuations in sales and profit levels.
- Typical product development includes 7 steps, ranging from idea generation to launch.
- Product-market fit exists if 40% of users would be disappointed if the product vanished.
The Three Levels of a Product in Marketing
The three levels of a product in marketing provide a structural framework for understanding how a item provides value, beginning with the fundamental reason for purchase and extending to the total customer experience. By analyzing your offering through these layers, you can identify how to differentiate your item from competitors and ensure you meet both explicit and implicit customer expectations.
| Product Value Layer | Primary Consumer Focus | Strategic Differentiation Opportunity | Example (Automotive) |
|---|---|---|---|
| Core Benefit | Functional Necessity | Defining the fundamental problem solved | Reliable point-to-point mobility |
| Actual Product | Tangible Specifications | Optimizing design, branding, and build quality | Engine efficiency, chassis design, and trim level |
| Augmented Product | Total Experience | Eliminating post-purchase friction through services | Extended warranties, roadside assistance, and financing |
- Core benefit: The fundamental need or desire the customer seeks to satisfy, such as the need for clean flooring or reliable transportation.
- Actual product: The tangible item or service that delivers the benefit, encompassing specific features, design, brand identity, quality levels, and protective packaging.
- Augmented product: The additional services and benefits that build around the core and actual elements, including warranties, post-sale support, installation instructions, and delivery guarantees.
Per University of Minnesota Libraries, the augmented product level is characterized by the integration of extra services and benefits—such as warranties, installation, customer support, and delivery terms—that wrap around the actual product to enhance the total offering. Examine whether your current augmented features successfully solve common post-purchase friction points to justify your pricing relative to the actual product quality.
To maximize the strategic impact of these product levels, consider these additional considerations for implementation:- Market Synchronization: Align the augmented features with specific customer personas to ensure the added value resonates with the target demographic.
- Life Cycle Evolution: Shift focus from the core benefit to augmented services as a product matures to maintain a competitive edge against commoditization.
- Feedback Integration: Utilize post-purchase friction points discovered during the augmented phase to inform iterative improvements to the actual product’s specifications.
- Perceived Value Mapping: Regularly audit whether your actual product attributes accurately reflect the brand identity promised at the core benefit level.
Convenience, Shopping, Specialty, and Unsought Goods Compared
Convenience, shopping, specialty, and unsought goods compared represent the classification system used to categorize consumer products based on purchasing habits and the level of effort exerted by the buyer. Per American Marketing Association, convenience goods are low-involvement items that consumers purchase frequently with minimal effort, whereas specialty goods are defined by unique characteristics that motivate buyers to exert significant effort to acquire them.
| Category | Purchase Frequency | Consumer Effort | Product Example |
|---|---|---|---|
| Convenience | High | Minimal | Snacks, milk |
| Shopping | Low to Moderate | High (comparison) | Clothing, appliances |
| Specialty | Very Low | Very High | Luxury watches |
| Unsought | Varies | Varies (often reactive) | Life insurance |
Understanding these distinctions is essential for aligning your distribution strategy with consumer expectations. Convenience goods require broad availability to minimize purchase friction, whereas specialty items demand controlled, exclusive placement to maintain brand status. Shopping goods benefit from being grouped near competitors to facilitate direct comparison, while unsought goods often require aggressive promotion to generate awareness of a need the consumer may not yet prioritize. Analyze your target customer’s typical buying behavior to determine which of these four categories your specific product occupies.
Strategic application of these categories can be optimized by implementing the following marketing tactics:- Prioritize intensive distribution channels for convenience goods to capture impulse and replenishment demand.
- Leverage omnichannel retail strategies for shopping goods to allow consumers to evaluate technical specifications before purchasing.
- Utilize selective or exclusive distribution for specialty goods to preserve perceived value and brand prestige.
- Employ direct-response marketing and educational content for unsought goods to overcome consumer indifference or lack of awareness.
What Happens to Sales and Profit at Each Stage of the Product Life Cycle?
Throughout the 4 stages of the product life cycle, you will observe sales and gross margin evolve as the product moves from initial high-cost introduction and rapid growth to peak maturity and eventual decline.
Typical Gross Margin by Category
Introduction and Growth: Building Sales While Profit Lags
Sales and profit dynamics across the 4 stages of the product life cycle vary significantly as a product moves from market entry to obsolescence. During the introduction phase, your sales are inherently low, and profit is often negative due to high investment costs associated with research, development, and market awareness. According to Harvard Business Review, it is common during this introduction stage for sales to be slow to develop and profits to remain negative as a result of heavy spending on development, market testing, and initial promotion. As you transition into the growth stage, sales rise at their fastest rate, yet profit remains constrained by the need for heavy promotional spending to capture market share.
Is Maturity the Most Profitable Stage?
Yes, maturity is typically the most profitable stage of the product life cycle because the costs of building market awareness diminish while sales volume reaches its peak. At this point, you benefit from economies of scale and established distribution channels.
How Gross Margin Shifts as Competition Rises
During the maturity phase, your margins often face downward pressure as competitors enter the space and force price adjustments. The following table highlights typical gross margin expectations for different product categories:
| Product Category | Typical Gross Margin |
|---|---|
| General Merchandise | 25% to 50% |
| Software and Digital Items | 70% to 80% |
Decline: Harvesting or Retiring the Product
In the final stage, both sales and profit inevitably fall as consumer preferences shift or new technologies render your offering obsolete. You must then decide whether to harvest the remaining value through reduced support or completely retire the product from your product mix.
Monitor your repeat purchase rate to determine if a decline is temporary or a terminal signal that you should reallocate resources to newer ventures.
Companies can employ several strategic tactics to sustain profitability as their product enters the maturity and decline phases:- Implement product differentiation to justify premium pricing against newer market entrants.
- Shift marketing focus toward customer retention and loyalty programs to reduce acquisition costs.
- Streamline supply chain operations to offset shrinking margins through improved logistics efficiency.
- Identify niche market segments that remain underserved to revitalize demand for aging products.
- Begin strategic harvesting or phased withdrawal to minimize losses once market relevance diminishes.
Steps of New Product Development and How Long Each Takes
Steps of new product development consist of 7 sequential phases that guide an idea from initial concept to commercial launch, a process that takes anywhere from a few months for simple goods to several years for complex ones. Per Harvard Business School, the stage-gate process is a widely adopted framework that utilizes distinct decision points after each of these development phases to evaluate project viability and mitigate financial risk.
| Stage-Gate Phase | Primary Objective | Risk Mitigation Focus |
|---|---|---|
| Idea Generation | Broad-spectrum innovation harvesting | Eliminating low-alignment concepts |
| Screening | Feasibility filtering | Preventing resource drain on unviable ideas |
| Concept Testing | Consumer demand validation | Reducing market fit uncertainty |
| Business Analysis | Economic forecasting | Ensuring alignment with profit margins |
| Prototyping | Technical proof of concept | Identifying design or functional flaws |
| Test Marketing | Real-world performance observation | Minimizing large-scale commercial exposure |
| Launch | Full-scale commercialization | Optimizing reach and market penetration |
Estimated New Product Failure Rates
- Idea generation: Gathering internal and external suggestions for a new product.
- Screening: Evaluating ideas to drop poor concepts early in the process.
- Concept testing: Presenting the product idea to target consumers to measure potential interest.
- Business analysis: Reviewing sales projections, costs, and profit expectations.
- Prototyping: Building a working model or version of the product to test viability.
- Test marketing: Introducing the product into limited market settings to observe performance.
- Launch: Executing the full-scale roll-out of the product to the target market.
Because the commonly cited failure rate for new consumer packaged goods ranges from 40% to 80% depending on the study and definition of failure, you should evaluate your current progress against these phases to identify which stage requires more rigorous risk assessment before you proceed to the next milestone.
Effective management of the product development lifecycle requires specific operational strategies to ensure seamless execution.- Cross-functional collaboration between engineering, marketing, and sales departments to ensure alignment.
- Iterative feedback loops utilizing pilot groups to refine features before wider exposure.
- Continuous monitoring of key performance indicators (KPIs) to track progress against development milestones.
- Agile resource allocation to pivot development efforts based on real-time data insights.
- Comprehensive post-launch reviews to document lessons learned and optimize future development cycles.
How Do You Know If a Product Has Reached Product-Market Fit?
You know a product has reached product-market fit when at least 40% of your current users report they would be very disappointed if the product were no longer available to them. This metric serves as a definitive threshold for determining if your offering provides enough value to sustain a loyal base and achieve long-term growth. Achieving this state indicates that the product successfully solves a significant problem for a specific group of people, moving beyond simple interest into essential utility.
| Evaluation Metric | PMF Threshold/Indicator | Purpose in Product Validation |
|---|---|---|
| Disappointment Survey | ≥ 40% “Very Disappointed” | Quantifies essential utility and user dependence. |
| Net Promoter Score | Positive Trend | Measures long-term advocacy and customer loyalty. |
| Retention/Repeat Purchase | Stabilized Rate | Confirms transition to sustainable, organic demand. |
| Market Footprint | Competitive Proportion | Validates presence against industry alternatives. |
To evaluate if your product has attained this status, you must analyze both quantitative performance data and qualitative sentiment indicators. Monitoring these specific benchmarks helps clarify your position:
- User sentiment survey results: A minimum of 40% of customers indicating “very disappointed” upon potential product removal.
- Net Promoter Score (NPS) feedback: Customer satisfaction scores measured on a scale from -100 to +100.
- Retention rates: Measuring the repeat purchase rate to confirm if users find sustained value.
- Market share percentage: Assessing your current footprint compared to industry competitors.
Beyond survey data, verify that your repeat purchase rate is stabilizing rather than declining, as this signals that the initial acquisition phase has transitioned into sustainable demand. Per the National Bureau of Economic Research, a reliable sign that a company has reached product-market fit in the United States involves achieving a sustained positive net promoter score alongside a high rate of repeat purchasing behavior within its target demographic.
To effectively monitor your progress toward product-market fit, consider these additional operational indicators:- Burn Multiple: Analyze how much your company spends to generate each dollar of new Annual Recurring Revenue (ARR) to ensure growth is capital-efficient.
- Activation Rate: Measure the percentage of sign-ups that successfully complete your core “Aha!” moment or primary product workflow.
- Time-to-Value (TTV): Track the duration required for a new user to experience the specific benefit that addresses their initial pain point.
- Organic Acquisition Ratio: Evaluate the percentage of new users arriving through word-of-mouth or search versus paid marketing channels to confirm viral potential.
Frequently Asked Questions
How do you measure product mix width, length, depth, and consistency?
You measure your product mix using four specific dimensions: width counts the number of product lines, length is the total number of items, depth is the number of variants per item, and consistency tracks how closely your product lines relate to one another in usage or production requirements.
Why do so many new products fail, and what is the typical failure rate?
The commonly cited failure rate for new consumer packaged goods is 40% to 80%, depending on the study and the definition of failure. Products often fail due to insufficient market research, poor execution during the 7 steps of product development, or a failure to meet a genuine consumer need.
What is a good gross margin for a product, physical versus digital?
A good gross margin for general physical merchandise is roughly 25% to 50%, while software and digital products can exceed 70% to 80%. These margins indicate the profitability of your product after accounting for the direct costs associated with its production, delivery, or maintenance within the market.
How do branding, packaging, and labeling differentiate a product from competitors?
Branding, packaging, and labeling differentiate a product by creating distinct visual and psychological identities that influence buyer perception. These levers establish quality levels and ensure compliance with regulatory standards, such as mandatory nutrition labeling or origin disclosures, which help your item stand out from alternatives on the retail shelf.
How do you position a product on a perceptual map against alternatives?
You position a product on a perceptual map by plotting its place in the buyer’s mind relative to competing alternatives using axes like price and quality. This visual tool helps you identify your competitive advantage and determine how your target audience perceives your specific product in relation to other options.