

Pricing Strategy: Markup and Margin, Approaches, Typical Margins, Price Elasticity, Market Entry Tactics, Break-even Volume, Discount Impact, Models, Psychological Techniques

A pricing strategy is the method a business uses to set the prices of its products or services. Key aspects include approaches, markup and margin, price elasticity, typical margins, break-even volume, market entry tactics, models, discount impact, and psychological techniques. Within marketing, price is the one element of the mix that directly produces revenue, so it shapes positioning, demand and profit together. You may see it applied to a local provider, such as one listed under digital marketing services near me, where prices reflect labor costs, competition and the value customers perceive. The article covers common approaches, the difference between markup and margin, and typical margin ranges across industries. It also explains how break-even volume is calculated and how price elasticity describes the response of demand to a change in price.
Key Takeaways
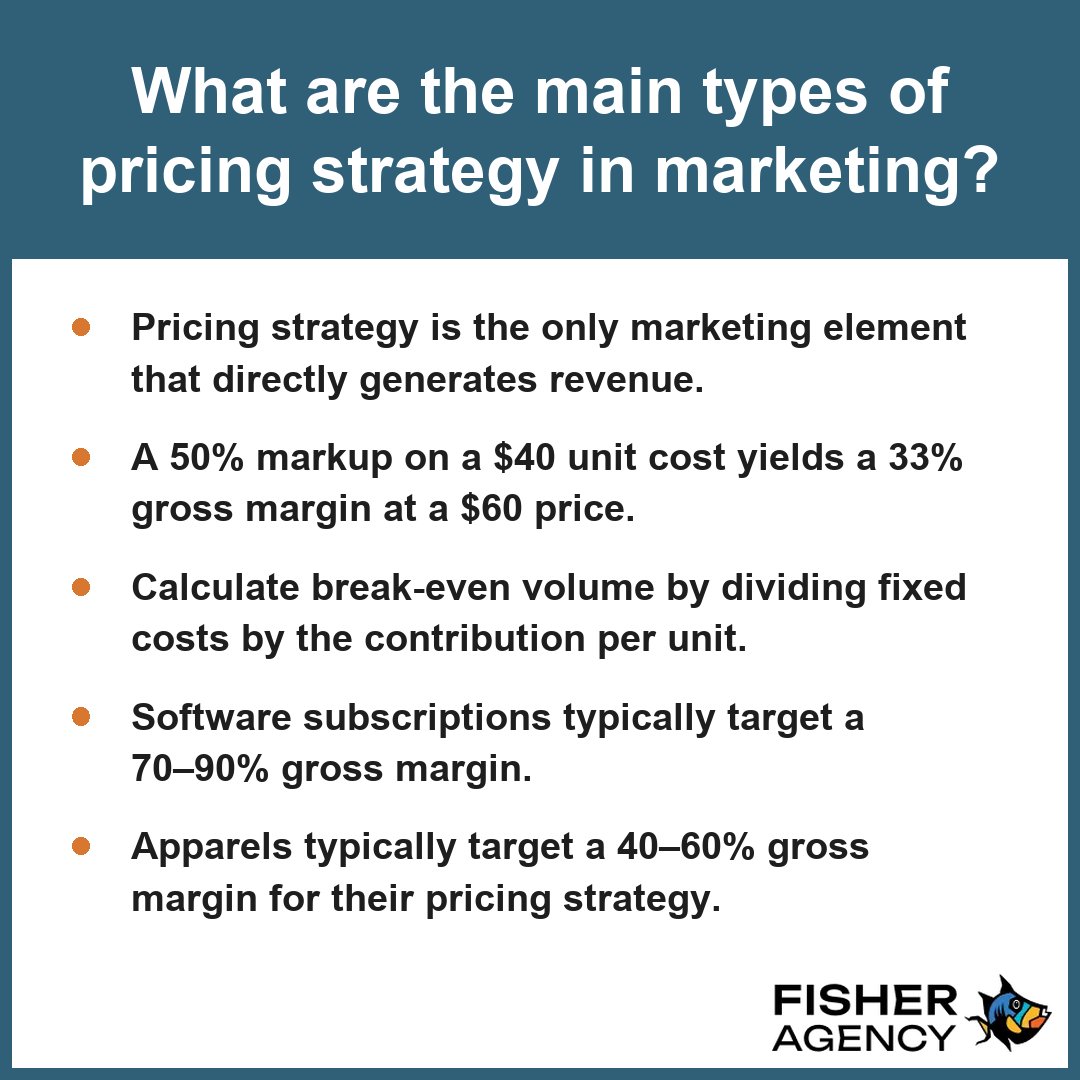
- Pricing strategy is the only marketing element that directly generates revenue.
- A 50% markup on a $40 unit cost yields a 33% gross margin at a $60 price.
- Calculate break-even volume by dividing fixed costs by the contribution per unit.
- Software subscriptions typically target a 70–90% gross margin.
- Apparels typically target a 40–60% gross margin for their pricing strategy.
Main Types of Pricing Strategy in Marketing
Main types of pricing strategy in marketing serve as the fundamental frameworks for how you set and adjust your revenue models based on market positioning, costs, and consumer behavior.
| Pricing Strategy | Primary Mechanism | Common Use Case |
|---|---|---|
| Cost-based pricing | Adds a markup to unit costs | Retail and manufacturing |
| Competition-based pricing | Positions against rival rates | Commoditized markets |
| Value-based pricing | Aligns with perceived benefits | Specialized or luxury goods |
| Penetration pricing | Sets low initial entry rates | New market share capture |
| Dynamic pricing | Adjusts based on real-time data | Travel and hospitality |
Beyond these primary categories, you may implement specialized tactics like psychological pricing to influence buyer perception or bundling to increase the average order value. For instance, while cost-based pricing provides a clear floor for your profit goals, it ignores external willingness to pay, whereas value-based pricing captures the maximum possible surplus from your audience. Per the Journal of Marketing, value-based pricing strategies in the United States market rely on shifting focus from production costs toward the perceived benefits for the consumer, which necessitates deep market research to accurately gauge a customer’s willingness to pay. When selecting your approach, you must evaluate if your internal cost structure or your external market positioning carries more weight in your long-term revenue objectives.
Audit your current sales data to determine if your realized revenue consistently aligns with the theoretical model of your chosen pricing strategy.
To refine your selection process, consider these additional factors when evaluating your final pricing model:- Evaluate the price elasticity of demand to determine how sensitive your target audience is to rate fluctuations.
- Assess your brand equity to ensure your price point aligns with the quality and status perceived by consumers.
- Monitor the long-term impact on customer lifetime value rather than focusing solely on immediate transaction margins.
- Conduct periodic A/B testing on pricing tiers to gather empirical data on conversion rates across different segments.
Markup vs. Gross Margin in Pricing Strategy: What Is the Difference?
You distinguish between these metrics in your pricing strategy by defining markup as the percentage added to your cost to determine the selling price, whereas gross margin represents the percentage of your selling price that constitutes profit after subtracting the cost. According to the Accounting Principles Board, generally accepted accounting principles require that gross margin be expressed as a percentage of net sales, which serves as a key distinction from markup, which is traditionally calculated as a percentage of a product’s unit cost.
Profitability Metrics Comparison (on $40 Cost)
How Markup Is Calculated
Markup is calculated as the percentage added to the cost of a good or service to determine its final price within your pricing strategy. By expressing the price increase as a fraction of the cost, you define the buffer between your expenses and your revenue.
How Gross Margin Is Calculated
Gross margin is calculated by measuring the difference between the price and the cost as a percentage of the total price. This figure indicates the proportion of revenue that remains after covering the direct costs associated with producing your product.
Converting a 50% Markup Into Gross Margin
When you apply a 50% markup to a $40 unit cost, you arrive at a $60 price. While the markup is 50%, the resulting gross margin is 33% because the profit is measured against the final $60 price rather than the initial $40 cost.
| Metric | Formula |
|---|---|
| Markup | (Price − Cost) / Cost |
| Gross Margin | (Price − Cost) / Price |
Why Mixing Them Up Costs You Money?
Mixing up these two metrics ruins your pricing strategy because it leads to inaccurate profit projections and unsustainable financial planning. If you mistake a 50% markup for a 50% gross margin, you will drastically underestimate the funds needed to cover operating expenses, often resulting in lower actual profitability than intended. Businesses often use specific industry standards to track these, such as:
- Apparel: 40–60% gross margin
- Software subscriptions: 70–90% gross margin
- Grocery retail: 20–30% gross margin
Audit your current price lists to verify that your internal financial models rely on gross margin percentages rather than markup figures to ensure your net profit targets are actually achievable.
Consider these practical implications when applying these metrics to your business operations:- Use markup to simplify the process of setting list prices based on known production expenses.
- Use gross margin to align your internal reporting with standard financial statements and investor expectations.
- Monitor margin trends to identify shifts in pricing power or fluctuations in raw material procurement costs.
- Set target margins before establishing prices to ensure that volume-based sales goals remain profitable.
What Is a Healthy Gross Margin When Setting a Pricing Strategy?
A healthy gross margin when setting a pricing strategy is defined by the specific cost structure and industry standards of your sector, as there is no single universal percentage that guarantees profitability. Per Investopedia, healthy gross margins are highly industry-dependent, with software companies in the United States often targeting 70% or higher due to low variable costs, while retail sectors typically operate with significantly lower margins due to inventory overhead. While your operating costs and overhead vary, your pricing strategy must aim to cover your expenses while maintaining a margin sufficient to fund growth and absorb fluctuations in variable costs.
| Business Sector | Representative Gross Margin Target | Standard Industry Range | Operating Cost Sensitivity |
|---|---|---|---|
| Grocery Retail | 25% | 20–30% | High (Inventory-Intensive) |
| Apparel Retail | 50% | 40–60% | Moderate (Inventory-Intensive) |
| Software Subscriptions | 80% | 70–90% | Low (Variable Cost Efficiency) |
Industry Average Gross Margin Benchmarks
Industry benchmarks provide a baseline to evaluate whether your current pricing strategy aligns with market expectations for profitability:
- Grocery retail: 20–30%
- Apparel: 40–60%
- Software subscriptions: 70–90%
When assessing these targets, keep in mind that a 50% markup on a $40 unit cost results in a $60 price, which yields a 33% gross margin. Because different sectors carry vastly different levels of fixed costs, comparing your performance to these ranges helps you determine if your pricing strategy provides enough buffer for your specific business model. If you are operating near the bottom of these ranges, a modest 1% price increase with no volume loss can often generate an operating profit lift of about 8–11%.
Analyze your current unit contribution against your total fixed costs to ensure your target margin supports the volume required to maintain solvency.
To determine if your current pricing strategy is effectively driving profitability, consider these strategic adjustments:- Evaluate the impact of high-volume sales strategies on your ability to lower unit costs through supplier negotiations.
- Analyze customer acquisition costs against your gross margin to ensure your pricing covers marketing and sales overhead.
- Identify potential price sensitivity thresholds by testing tiered pricing models against historical conversion data.
- Assess whether your variable costs include hidden logistics or fulfillment expenses that are eroding your target margin.
How to Calculate Break-Even Volume When Choosing a Pricing Strategy
Calculating break-even volume for your chosen pricing strategy requires determining the exact number of units you must sell to cover all fixed costs without incurring a loss. This metric serves as the foundation for your financial safety net, ensuring your chosen price point does not fail to recoup your operating investments.
| Strategic Scenario | Price Adjustment | Gross Margin Baseline | Required Sales Volume Increase |
|---|---|---|---|
| Standard Pricing | 0% (Baseline) | 40% | 0% (Maintain) |
| Aggressive Discounting | -10% | 40% | +33% |
Sales Volume Impact of 10% Price Discount
- Identify your total fixed costs, which are expenses that remain constant regardless of your sales volume, such as rent, insurance, and salaries.
- Calculate the contribution per unit by subtracting the variable cost per unit—the direct cost of labor and materials to produce one item—from your planned selling price.
- Divide the total fixed costs by the contribution per unit to find the break-even volume. According to Harvard Business School, the break-even volume is approximately found by dividing total fixed costs by the unit contribution margin, defined as the selling price per unit minus the variable costs. For example, if your fixed costs are $100,000 and your contribution per unit is $20, you must sell 5,000 units to reach your break-even volume.
When you evaluate potential changes to your pricing strategy, keep in mind that a 10% discount on an item with a 40% gross margin requires a sales volume increase of about 33% just to maintain the same total gross profit. Compare your calculated break-even volume against realistic market demand projections to ensure your pricing strategy is commercially viable before implementation.
Follow these secondary considerations to refine your break-even analysis and ensure long-term profitability:- Include a buffer for unexpected overhead fluctuations, such as utility rate hikes or emergency maintenance costs.
- Perform sensitivity analysis by adjusting variable cost projections to account for potential supply chain inflation.
- Segment your break-even analysis by product line to identify which offerings provide the highest contribution margin versus those that require high volume.
- Monitor customer acquisition costs alongside your break-even volume to ensure the cost of winning new sales does not erode your margin gains.
How Price Elasticity of Demand Affects Pricing Strategy
How price elasticity of demand affects pricing strategy involves measuring how the quantity of a product sold responds to changes in its price. When you determine your pricing strategy, calculating this coefficient helps you predict whether a price hike will increase total revenue or cause a disproportionate loss in customers. If the value is below −1, demand is elastic, meaning a small price reduction can significantly boost volume and total revenue. If the value falls between 0 and −1, demand is inelastic, suggesting that you can safely raise prices because volume will not drop enough to offset the gains from higher unit revenue.
| Product Category | Elasticity Coefficient | Demand Classification | Pricing Strategy Implication |
|---|---|---|---|
| Gasoline (Short-term) | -0.2 to -0.5 | Inelastic | High latitude for price increases |
| Essential Utilities/Medical | 0.0 to -1.0 | Inelastic | Revenue stability during price hikes |
| Standard Consumer Goods | -1.0 | Unitary | Revenue remains constant with price changes |
| Luxury Goods/Substitutes | Below -1.0 | Elastic | Price reductions favor volume growth |
Elasticity Coefficient Range Estimates
Understanding these sensitivities allows you to calibrate your pricing strategy based on the nature of your goods:
- Highly elastic goods: Often luxury items or products with many close substitutes; small price changes lead to large shifts in demand.
- Inelastic goods: Typically essential products or goods with limited alternatives, such as the short-term price elasticity of demand for gasoline, which is about −0.2 to −0.5. Per the Federal Reserve Bank of St. Louis, essential goods like medical services or utilities often demonstrate this inelasticity, as consumer demand generally stays stable during price hikes, granting firms in those industries greater leeway to increase prices without experiencing a major decline in sales volume.
- Unitary elasticity: Occurs when the percentage change in quantity demanded exactly equals the percentage change in price, resulting in no change to total revenue.
Analyze historical sales data during past price adjustments to estimate your product’s specific sensitivity before implementing a new pricing strategy.
Follow these additional operational steps to refine your pricing strategy based on demand sensitivity:- Conduct A/B price testing on a small, segmented audience to empirically validate your product’s specific elasticity coefficient.
- Monitor competitor pricing shifts in real-time, as the availability of close substitutes can cause your product’s elasticity to shift from inelastic to elastic.
- Analyze historical sales data during past price changes to calculate the actual percentage change in quantity demanded versus percentage change in price.
- Segment your customer base, as elasticity often varies significantly between price-sensitive budget shoppers and brand-loyal premium buyers.
Frequently Asked Questions
Should a new product use penetration pricing or price skimming?
You should use penetration pricing when you aim to win market share quickly through a low entry price, or price skimming if you intend to start with a high price for early adopters and lower it over time to maximize revenue across different customer segments.
Does charm pricing like $9.99 really work in a pricing strategy?
Yes, charm pricing like $9.99 works by influencing consumer perception, as tests often report that it lifts sales by a few percent compared to round numbers. While effectiveness varies by product and audience, it remains a common tactic within a broader psychological pricing framework.
Which pricing model is best for software: freemium, subscription, or tiered pricing?
The most effective structure for software is typically a tiered pricing model featuring three levels, known as good, better, and best. This approach frequently targets the middle tier while aiming for the standard software subscription gross margin, which typically ranges between 70–90%.
How much do discounts hurt profit compared to raising prices?
Discounts significantly impact profitability, as a 10% discount on a 40% gross margin item requires a 33% increase in volume just to maintain the same gross profit. Conversely, a 1% price increase with no loss of volume typically raises your operating profit by about 8–11%.
How do you decide whether a bundle should be priced below the sum of its individual products?
You should bundle products below their individual prices to increase average order value and move slow-selling items as part of your pricing strategy. This method balances consumer value against your overall revenue goals by encouraging customers to purchase more units than they would have bought otherwise.