

Behavioral Segmentation: RFM Scoring, Variable Types, Use Cases, Data Sources, Loyalty Status, Usage Rate, Success Metrics, Methods, Segment Count
Behavioral segmentation is the practice of grouping customers by their actions, such as purchases, usage, and engagement with a brand. Key aspects include variable types, RFM scoring, data sources, use cases, usage rate, loyalty status, methods, success metrics, and segment count. You apply it by collecting records of what customers actually do and sorting them into groups that share similar patterns. Within marketing, these groups guide decisions about messaging, timing, offers, and retention efforts. Even a search such as marketing agency near me reflects behavior, since the query itself signals intent that can be recorded and grouped. This article explains the main variable types, how RFM scoring ranks customers by recency, frequency, and monetary value, and which data sources feed the process. It also covers usage rate and the most common use cases you can expect to encounter.
Key Takeaways
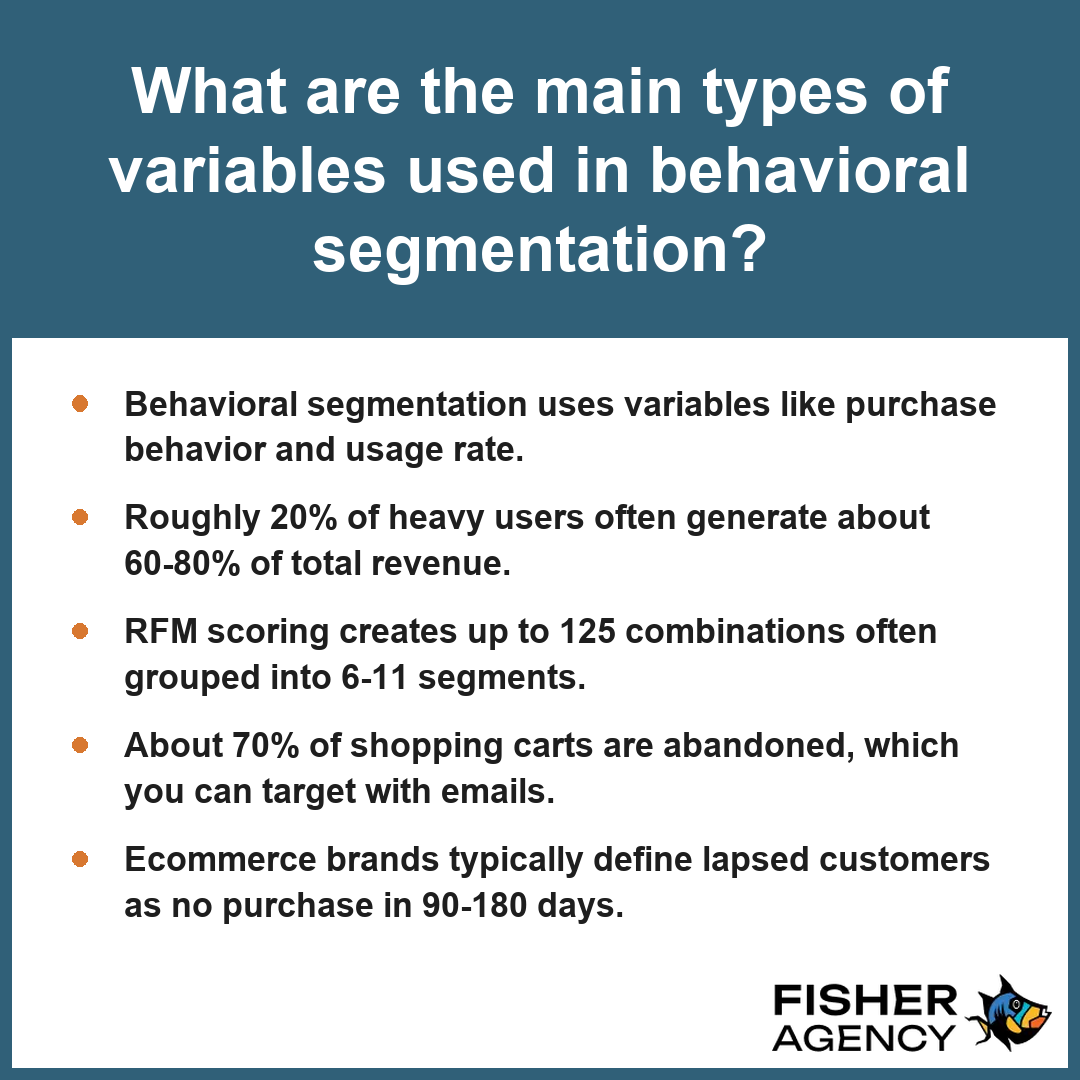
- Behavioral segmentation uses variables like purchase behavior and usage rate.
- Roughly 20% of heavy users often generate about 60-80% of total revenue.
- RFM scoring creates up to 125 combinations often grouped into 6-11 segments.
- About 70% of shopping carts are abandoned, which you can target with emails.
- Ecommerce brands typically define lapsed customers as no purchase in 90-180 days.
What Are the Main Types of Variables Used in Behavioral Segmentation?
The main types of variables used in behavioral segmentation are defined by distinct categories of customer actions and motivations that allow you to group individuals based on how they interact with your brand rather than static demographic traits. By applying these variables to your customer records, you create actionable clusters that help align your communications with the actual stage and intent of your audience.
| Behavioral Variable | Primary Data Focus | Strategic Application |
|---|---|---|
| Purchase Behavior | Transaction history and basket composition | Predicting future engagement cycles and order value |
| Usage Rate | Pareto-based frequency of interaction | Prioritizing high-value retention for top 20% tier |
| Occasion or Timing | Calendar-driven and milestone-based activity | Aligning campaign delivery with peak responsiveness |
| Benefits Sought | Value proposition prioritization | Targeting based on specific consumer motivations |
| Loyalty Status | Customer lifecycle stage | Mitigating churn and incentivizing repeat purchase |
Pareto Distribution of Revenue
- Purchase behavior: Tracks historical transactional data such as spend per order, average basket size, the specific product categories bought, and the primary channel used for the transaction. Per the Journal of Marketing, these variables are useful because they categorize consumers based on the frequency, timing, and nature of their transactions to predict future buying patterns and engagement cycles.
- Usage rate: Monitors how often a customer engages with your product, typically following the Pareto pattern where roughly 20% of customers generate about 60-80% of revenue.
- Occasion or timing: Segments users based on their responsiveness to specific calendar events, such as seasonal holidays, recurring sales windows, or milestone dates.
- Benefits sought: Sorts buyers based on the primary value proposition they prioritize, such as price, quality, status, or convenience.
- Loyalty status: Categorizes customers into groups like new, repeat, or lapsed customers, with many ecommerce brands defining the latter as those showing no purchase in 90-180 days.
- Readiness stage: Aligns with the sales funnel by identifying if a prospect is currently unaware, interested, or intending to buy.
- Attitude toward the product: Measures the qualitative sentiment or level of enthusiasm a customer displays in their interactions with your brand offerings.
Audit your existing customer database to determine which of these specific variables currently possesses the highest volume of reliable, clean data for your initial grouping efforts.
To effectively implement these behavioral variables, consider the following tactical approaches:- Integrate real-time behavioral triggers into automated email workflows to respond immediately to specific user actions.
- Conduct A/B testing on messaging variations to determine which benefit-driven value proposition resonates most strongly with different segments.
- Cross-reference behavioral clusters with customer support interaction logs to identify friction points that might impact long-term loyalty.
- Use predictive modeling to map historical purchase intervals against future campaign scheduling to maximize conversion probability.
What Data Do You Need to Start Behavioral Segmentation?
The data you need to start behavioral segmentation consists of high-fidelity logs capturing specific customer actions across your digital and physical touchpoints. To build effective groups, you must aggregate granular event logs into a centralized repository where you can compute key performance indicators, such as customer lifetime value or purchase frequency. Accessing these disparate sources allows you to transform raw digital breadcrumbs into actionable profiles that guide your messaging strategies. Per the National Institute of Standards and Technology, there are voluntary standards available to help organizations identify and manage the privacy risks associated with collecting the behavioral data used in these segmentation efforts.
| Data Source Category | Behavioral Signal Captured | Strategic Segmentation Utility |
|---|---|---|
| Transaction Records | Monetary history and SKU-level selection | Calculates Customer Lifetime Value and purchase frequency tiers |
| Web/App Analytics | Navigation paths and interaction depth | Quantifies digital engagement and interest-based intent |
| Email Engagement | Response latency and interaction frequency | Provides 10-100% lift metrics for targeted campaign optimization |
| Customer Support | Sentiment and interaction hurdles | Identifies churn risk profiles and friction-based segments |
| Loyalty Programs | Tier status and cross-channel activity | Enables long-term behavioral tracking and VIP identification |
Lift in Email Performance from Segmentation
- Transaction records: Centralized databases providing purchase frequency, average order value, and specific product categories bought.
- Web and app analytics: Event-level data tracking session duration, pathing, and search queries to determine engagement levels.
- Email engagement metrics: Performance data including open and click-through rates, which typically see a 10-100% lift when targeting specific segments compared to unsegmented sends.
- Customer support logs: Qualitative interaction data that identifies friction points or potential churn triggers.
- Loyalty program data: Membership details that clarify loyalty status and allow for tracking interactions beyond standard purchase behavior.
- Marketing response history: Records of how users interact with promotional campaigns, such as holiday offers or seasonal sales.
Audit your current data architecture to ensure that individual identifiers are consistently synced across your web, email, and transaction systems before initiating your first segment build.
To derive maximum value from these behavioral datasets, consider the following integration and validation steps:- Establish a unified customer identifier (UID) to map disparate touchpoints to a singular user profile.
- Implement real-time data cleansing protocols to eliminate duplicate records and stale behavioral signals.
- Apply machine learning clustering algorithms to discover hidden segment correlations beyond predefined KPIs.
- Conduct periodic A/B testing on segment-specific messaging to validate the predicted lift metrics.
- Audit data collection pipelines against privacy frameworks to ensure ongoing regulatory compliance.
How Does RFM Scoring Work in Behavioral Segmentation?
RFM scoring functions in behavioral segmentation by assigning numerical values to your customers based on their purchase behavior—specifically their recency, frequency, and monetary contribution—to categorize them into distinct groups such as heavy users or lapsed customers for targeted marketing strategies. Per the Direct Marketing Association, this form of analysis segments customers by assigning numerical values to the recency of their last purchase, the frequency of their total transactions, and the monetary value of their lifetime spend.
| RFM Segment Profile | Recency Rank (1-5) | Frequency Rank (1-5) | Monetary Rank (1-5) | Strategic Objective |
|---|---|---|---|---|
| Champions | 5 | 5 | 5 | Reward loyalty and incentivize advocacy |
| Loyal Customers | 3-4 | 4-5 | 3-5 | Upsell premium product tiers |
| Potential Loyalists | 4-5 | 2-3 | 2-3 | Nurture and offer membership programs |
| At-Risk Customers | 1-2 | 3-5 | 3-5 | Re-engage with win-back campaigns |
| Hibernating/Lapsed | 1-2 | 1-2 | 1-2 | Evaluate for cost-effective re-activation |
RFM Metric Scoring Range
How Recency, Frequency, and Monetary Scores Are Assigned
RFM scoring functions in behavioral segmentation by evaluating three distinct dimensions of customer purchase behavior, typically assigning a rank from 1 to 5 for each. This quantitative approach transforms raw transaction data into a structured profile, resulting in up to 125 unique mathematical combinations. You calculate these values based on the following specific criteria:
- Recency: How long ago the last purchase occurred.
- Frequency: The total number of transactions within a defined period.
- Monetary: The total cumulative spend of the customer.
How Do You Turn RFM Combinations Into Usable Segments?
Naming Groups Such as Champions and At-Risk Customers
You turn the mathematical combinations generated by RFM scoring into actionable strategy by grouping them into 6-11 named segments. By collapsing the raw data into practical buckets, you can apply distinct communication strategies to different tiers of the customer base. For instance, customers with high scores across all three dimensions are often labeled as Champions, while those who have not transacted within the typical 90-180 day window for lapsed customers are categorized as lost or at risk. This method allows you to move beyond raw data and implement targeted retention efforts that align with the specific habits of your audience.
Where RFM Scoring Falls Short
RFM scoring is inherently limited because it relies strictly on historical transaction data, which ignores the qualitative reasons behind the behavior. While it identifies who is purchasing, it does not account for benefits sought or a customer’s specific readiness stage, meaning it may miss the context of why a customer stopped engaging. It also fails to incorporate external factors or browsing interactions that occur before a purchase is finalized. Assess whether your current customer database contains enough historical depth to distinguish between long-term loyalty and one-off bulk purchases before relying solely on these metrics.
To implement an effective RFM analysis, follow these operational steps:- Define the specific time intervals for the Recency score based on your business’s typical purchase cycle.
- Calculate quintiles for Frequency and Monetary values to ensure an even distribution of customers across the 1–5 scoring spectrum.
- Combine the three individual scores into a single RFM string (e.g., 555) to create a unique identifier for each customer segment.
- Automate the data ingestion process to ensure scores are recalculated dynamically after every transaction.
- Map each RFM segment to specific automated email or marketing workflows to trigger personalized messaging.
How Heavy Users Differ From Light Users and Why They Matter Most
Heavy users differ from light users because they represent a disproportionately large share of total revenue based on their purchase behavior. Per Harvard Business Review, the Pareto Principle frequently applies to behavioral marketing, where a small percentage of heavy users often generates a disproportionate share of a company’s total revenue. When applying behavioral segmentation to analyze usage rate, you will observe the Pareto pattern, which shows that roughly 20% of your customers—the heavy users—often generate about 60-80% of your total revenue. While light users might interact with your brand only occasionally, heavy users demonstrate high engagement and consistent repeat purchases, making them the most significant contributors to your customer lifetime value.
| Metric | Heavy Users (Top 20%) | Light Users (Remaining 80%) | Strategic Resource Allocation |
|---|---|---|---|
| Purchase Frequency | High: Consistent, repeat patterns | Low: Occasional, irregular transactions | Prioritize retention and loyalty programs |
| Lifetime Value Contribution | Primary: Majority of cumulative revenue | Secondary: Marginal incremental gains | Invest heavily in relationship management |
| Campaign Responsiveness | High: Predictive of conversion | Low: Highly sensitive to acquisition cost | Target with high-touch personalized offers |
| Communication Strategy | VIP access and community engagement | Automated, cost-efficient touchpoints | Optimize ROI based on marginal spend |
Revenue Contribution: Pareto Distribution
You should prioritize heavy users because their high engagement levels provide the best return on investment for your retention efforts. Conversely, while light users should not be ignored, their lower contribution levels require a more cost-effective communication strategy. You can compare these two groups across several key metrics to guide your resource allocation:
- Purchase frequency: Heavy users return significantly more often than the average or light user.
- Customer lifetime value: Heavy users yield higher cumulative revenue per capita over time.
- Marketing responsiveness: Heavy users typically show higher conversion rates on triggered campaigns compared to infrequent buyers.
- Average order value: Heavy users often exhibit larger basket sizes per transaction.
Identify the specific threshold of orders per year that separates your top 20% from the rest of your base to refine your loyalty status communications.
To maximize the impact of these behavioral segments, consider these implementation strategies:- Implement automated win-back workflows for light users to identify potential churn before it occurs.
- Deploy exclusive feedback loops or beta-testing programs to deepen the loyalty of your top-tier heavy users.
- Utilize lookalike modeling based on heavy user attributes to refine your customer acquisition targeting.
- Calculate the specific cost-to-serve for both segments to ensure that high-touch engagement remains profitable.
How Behavioral Segmentation Helps Recover Abandoned Carts
Behavioral segmentation helps recover abandoned carts by enabling you to deliver precisely timed, relevant messaging to users who have demonstrated high intent but failed to complete a purchase. Baymard Institute reports that consumers in the United States abandon approximately 70% of online shopping carts, making this a critical behavioral segment for automated recovery outreach and a chance to shift your approach from generic reminders to personalized interventions based on the user’s specific stage in the process.
| Abandonment Behavioral Segment | Recommended Recovery Strategy | Incentive Threshold | Primary Conversion Metric |
|---|---|---|---|
| High-Intent New Visitors | Contextual product reassurance & social proof | None (Educational focus) | Click-Through Rate |
| Returning Loyal Customers | Simplified re-order reminder & loyalty point balance | None (Convenience focus) | Return-to-Cart Ratio |
| Price-Sensitive Window Shoppers | Urgency-based offer or limited-time discount | Margin-protected % off | Checkout Completion Rate |
| Late-Stage Checkout Drop-offs | Friction-removal assistance (e.g., shipping/payment support) | Free shipping voucher | Revenue per Email Sent |
Lift in Engagement via Segmentation
- Identify the specific product or service category that triggered the abandonment to ensure your communication remains contextually relevant.
- Segment the cart-abandoning users based on their historical loyalty status to determine if a simple reminder suffices or if an incentive is required to convert them.
- Deploy a series of automated abandoned-cart emails triggered by the user’s inaction, utilizing behavioral data to customize the subject line and call to action.
- Monitor the click-through rates of your messaging, as effective behavioral segmentation typically yields a lift in open and click rates of 10-100% compared to unsegmented sends.
- Analyze the conversion data from these specific segments to refine the time delays between the abandonment event and the follow-up message.
Review your average order value data against the cost of your recovery incentives to ensure that the discounts offered in your abandoned-cart emails protect your profit margins.
Follow these implementation steps to refine your recovery messaging and improve overall campaign performance:- Integrate real-time browsing data to trigger automated flows within 30 to 60 minutes of abandonment.
- A/B test subject lines to differentiate between curiosity-based hooks and value-based incentives.
- Monitor unsubscribe rates closely to ensure your outreach remains helpful rather than intrusive.
- Utilize dynamic content blocks to surface the exact items left in the cart alongside complementary cross-sell options.
- Audit your checkout flow to identify technical barriers that may be causing specific “Late-Stage” drop-offs.
Frequently Asked Questions
How do you define a lapsed customer in behavioral segmentation by loyalty status?
A lapsed customer in behavioral segmentation by loyalty status is typically defined for ecommerce brands as a user with no purchase in 90-180 days. You categorize these individuals by their lack of recent activity to trigger specific win-back campaigns intended to re-engage them before they are permanently lost.
Should I use rule-based filters or k-means clustering for behavioral segmentation?
You should choose between rule-based filters or k-means clustering based on the complexity of your data and your need for statistical precision. While simple rule-based filters provide immediate, actionable segments, k-means clustering allows you to automate the discovery of nuanced groups using predictive models to score likelihood to churn.
How do you measure whether behavioral segmentation is working?
You measure whether behavioral segmentation is working by tracking performance metrics like email open and click-through rates, which often see a lift of 10-100% compared to unsegmented sends. You should also monitor key indicators such as customer lifetime value, churn rate, and the reduction in the typical 70% cart abandonment rate.
What are the limitations of behavioral segmentation, and how do privacy laws affect it?
Behavioral segmentation is limited by the quality of your data sources, such as transaction records and web analytics, and must comply with privacy laws that restrict tracking user activity without consent. You must ensure that your data collection from CRM logs or email engagement respects current global digital privacy standards.
How many segments should a behavioral segmentation program have?
A behavioral segmentation program should have 3-8 segments for practical use. You can define these by various factors such as usage rate, readiness stage, or benefits sought, while using RFM scoring to collapse up to 125 possible combinations into 6-11 manageable groups for your tactical business needs.